A 5% drop in sand recovery doesn't sound dramatic until you calculate what it costs. A mid-sized foundry running 40 tons of resin sand daily loses 2 tons to waste instead of reclaiming it. At $150 per ton for new sand plus $80 per ton for disposal, that's $460 per day — $168,000 annually — disappearing because crusher liners wore down or screen meshes clogged.
Recovery rate decay happens gradually. Your line runs at 96% for six months, then 93%, then 89%. By the time operators notice the drop, you've already burned through thousands in extra sand purchases. The fix isn't complicated, but it requires a maintenance schedule tied to the components that actually control recovery performance.
Why Sand Reclamation Recovery Rates Decay
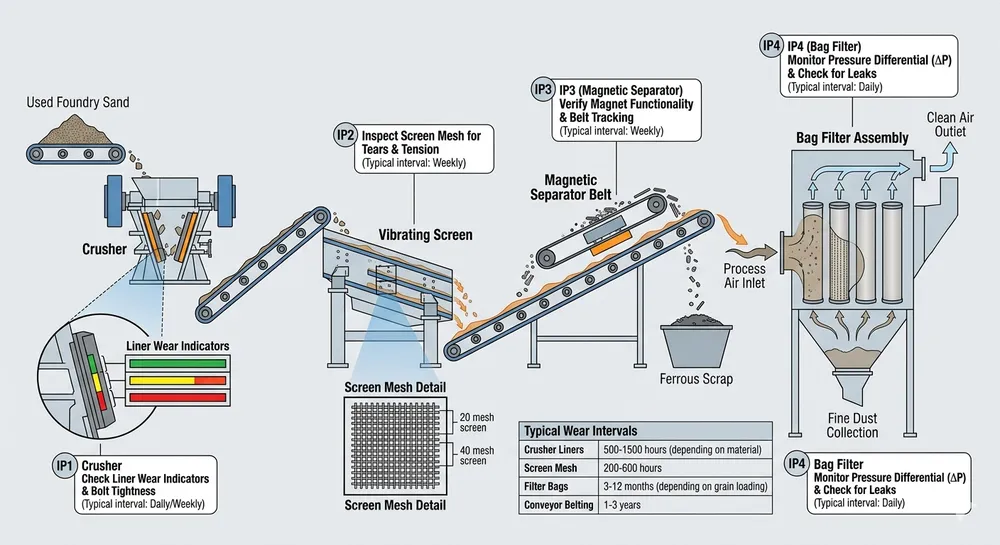
Sand recovery depends on three mechanical processes working correctly: crushing removes binder film from used sand grains, screening separates reclaimed sand from oversized lumps and dust fines, and magnetic separation pulls out metallic contamination. When any of these processes degrades, your recovery rate drops.
Crusher liner wear is the most common culprit. Impact crushers use replaceable liners (typically manganese steel or high-chromium cast iron) to break apart binder-coated sand lumps. As liners wear, the crushing gap widens from the designed 3-5mm to 8-10mm. Larger gaps mean incomplete binder removal — sand grains still carry resin film, fail LOI testing, and get rejected as waste instead of returning to the mixer.
Screen mesh blinding happens when fine dust or partially crushed binder clogs the apertures in your vibrating screens. A reclamation line typically uses 20-mesh (0.85mm) and 40-mesh (0.425mm) screens to separate reclaimed sand from fines and lumps. When 30% of the screen surface blinds over, throughput drops and oversized particles contaminate the reclaimed sand stream. Your sand looks clean but fails grain fineness testing.
Magnetic separator belt wear and gauss rating drift let metallic contamination through. Resin sand picks up steel shot, weld spatter, and casting fragments during shakeout. Magnetic separators (typically 1200-1500 gauss for ferrous removal) pull these out before sand returns to storage. Belt wear creates gaps where metal particles slip past. Magnet strength also decays — a separator rated at 1400 gauss when new might drop to 1100 gauss after 18 months, missing smaller ferrous particles that later damage your mixer blades.
Dust collection filter saturation reduces airflow through the reclamation system. Most lines use bag filters or cartridge filters to capture silica dust and binder combustion products. When filters load up, suction drops from the designed 2000-2500 m³/h to under 1500 m³/h. Reduced airflow means dust settles back onto reclaimed sand instead of getting extracted, raising your LOI numbers and contaminating the final product.

Critical Wear Components and Inspection Intervals
Your maintenance schedule should track these components based on tonnage processed, not just calendar time. A line running 30 tons per day wears differently than one running 80 tons per day.
Crusher liners: Inspect every 500 tons processed (roughly every 2 weeks for a 40-ton/day operation). Measure the crushing gap with feeler gauges at three points around the rotor. If the gap exceeds 6mm anywhere, schedule liner replacement. Manganese steel liners typically last 2000-3000 tons; high-chromium liners go 4000-5000 tons but cost 40% more. We've seen foundries run liners to 8mm gaps trying to stretch replacement intervals — they save $800 on liners but lose $3000 in recovery rate drop over those extra two weeks.
Vibrating screen meshes: Visual inspection daily, tension check weekly, replacement every 1000-1500 tons. Look for visible holes, stretched sections, or blinded areas covering more than 20% of the surface. Screen tension matters — loose meshes vibrate inefficiently and let oversized particles through. Use a tension meter if your screens have adjustable frames. Polyurethane screens last longer than woven wire (2000+ tons vs 1000 tons) but cost twice as much upfront.
Magnetic separator belts and magnets: Check belt tracking and surface condition daily. Test gauss rating monthly with a gaussmeter at five points across the belt width. Replace belts when surface wear exposes the fabric backing or when tracking adjustment no longer centers the belt. Magnet strength should stay above 1200 gauss for effective ferrous removal — if readings drop below that, the magnet assembly needs remagnetization or replacement. Belt life runs 6-12 months depending on sand abrasiveness; magnets should hold strength for 3-5 years unless you're running very high temperatures.
Dust collection filters: Monitor differential pressure daily. Most bag filter systems show 800-1200 Pa when clean, 1800-2200 Pa when filters need cleaning or replacement. If pressure exceeds 2000 Pa, airflow has dropped enough to affect dust capture. Pulse-jet cleaning systems should fire every 30-60 seconds during operation. Bags typically last 8-12 months; cartridge filters go 12-18 months. Don't wait for complete filter failure — a clogged filter costs you in recovery rate long before it stops working entirely.
Step-by-Step Preventive Maintenance Schedule
This schedule assumes a mechanical reclamation line processing 30-50 tons of resin sand daily. Adjust intervals proportionally for higher or lower throughput.
Daily Operator Checks (10 minutes at shift start)
- Crusher: Listen for abnormal noise (grinding, rattling, or knocking indicates liner damage or loose components). Check oil level in crusher gearbox — low oil causes bearing failure within hours.
- Vibrating screens: Confirm both decks are vibrating with consistent amplitude. Look for sand buildup on screen frames (indicates poor material flow or screen blinding).
- Magnetic separator: Verify belt is tracking centered and rotating smoothly. Check discharge chute for metallic buildup (indicates magnet weakness or belt gap).
- Dust collector: Read differential pressure gauge. If above 1800 Pa, trigger manual pulse cleaning or schedule filter inspection.
- PLC display: Check for error codes or alarm history. Note any parameter drift (motor current, vibration sensor readings, throughput rate).
Weekly Parameter Audits (30 minutes)
- Crusher gap measurement: Use feeler gauges to measure crushing gap at rotor top, sides, and bottom. Record measurements in maintenance log. Gap should stay 3-5mm; anything over 6mm requires liner replacement planning.
- Screen mesh tension and condition: Inspect for holes, stretched sections, or blinded areas. Clean screens with compressed air if dust buildup is visible. Check screen frame bolts for looseness.
- Magnetic separator gauss test: Use a gaussmeter to measure field strength at five points across the belt. Record readings. Strength below 1200 gauss means magnet service is due.
- Dust collector pulse system test: Manually trigger pulse cleaning and verify all solenoid valves fire. Check compressed air pressure (should be 5-6 bar for effective cleaning).
- Sand sample LOI test: Pull a sample from reclaimed sand discharge and run loss-on-ignition testing. Target LOI should be under 0.3% for furan sand, under 0.5% for phenolic. Higher numbers indicate incomplete binder removal.
Monthly Component Replacements and Deep Inspections (2-4 hours)
- Crusher liner inspection and replacement: Remove inspection covers and visually check liner wear patterns. Replace liners if gap exceeds 6mm or if you see cracks or chunks missing. Torque all liner bolts to spec (typically 200-250 N⋅m for M16 bolts). Check crusher rotor balance — vibration above 8 mm/s indicates imbalance or bearing wear.
- Screen mesh replacement: Replace any mesh showing holes, tears, or blinding over 30% of surface area. Tension new meshes to manufacturer spec (typically 40-60 N/cm for polyurethane, 30-50 N/cm for woven wire). Verify screen frame mounting bolts are tight.
- Magnetic separator belt and roller inspection: Check belt for cuts, gouges, or fabric exposure. Inspect drive and idler rollers for bearing noise or wobble. Lubricate roller bearings per manufacturer schedule (typically every 500 hours).
- Dust collector filter inspection: Open filter compartment and visually inspect bags or cartridges. Replace any showing holes, caking, or permanent deformation. Check pulse valve diaphragms for wear — replace if cracked or stiff.
- PLC data download and analysis: Pull 30 days of operating data from the PLC. Look for trends in motor current (rising current indicates mechanical resistance), throughput rate (declining rate indicates capacity loss), and alarm frequency (increasing alarms signal component degradation).

Diagnostic Table: Recovery Rate Drop Symptoms and Root Causes
When your recovery rate drops, the symptom tells you where to look. This table maps common performance issues to their mechanical causes and corrective actions.
| Symptom | Root Cause | Diagnostic Check | Corrective Action |
|---|---|---|---|
| LOI above target (>0.3% furan, >0.5% phenolic) | Crusher gap too wide, incomplete binder removal | Measure crusher gap with feeler gauges | Replace crusher liners if gap >6mm |
| Oversized lumps in reclaimed sand | Screen mesh holes or loose tension | Visual inspection, tension measurement | Replace damaged mesh, retension screens to spec |
| Metallic contamination in reclaimed sand | Magnetic separator belt gap or weak magnets | Gauss test, belt tracking check | Replace worn belt, remagnetize or replace magnets if <1200 gauss |
| High dust content in reclaimed sand | Dust collector filter saturation, low airflow | Check differential pressure, measure airflow | Replace filters if pressure >2000 Pa, clean pulse valves |
| Excessive fines (sand passing through 40-mesh) | Crusher over-crushing, worn screen meshes | Sieve analysis, crusher gap check | Increase crusher gap slightly, replace fine screens |
| Declining throughput rate | Multiple: screen blinding, crusher wear, filter clogging | PLC throughput data, visual inspection of all components | Address highest-wear component first, then retest |
| Inconsistent sand grain fineness | Screen mesh damage or uneven vibration | Grain fineness number test, vibration amplitude check | Replace screens, check vibrator motor mounts and springs |
| Rising motor current on crusher | Bearing wear, material buildup, liner damage | Vibration test, bearing temperature, visual inspection | Replace bearings if vibration >8 mm/s, clean buildup, replace liners |
The most expensive mistake is treating all recovery rate drops the same way. A foundry we worked with in 2022 kept replacing screen meshes every month because their LOI stayed high — they spent $4000 on screens before someone finally measured the crusher gap and found it at 9mm. New liners fixed the problem in one day.
PLC Data Logging and Remote Diagnostics
Modern sand reclamation lines ship with Siemens or Mitsubishi PLCs that log operating parameters continuously. If your line has remote diagnostics (4G module or Ethernet connection), your maintenance team can pull this data without walking to the control panel.
Motor current trending catches mechanical problems before they cause failures. Crusher motor current should stay within ±10% of baseline (typically 35-45A for a 30 kW crusher motor at full load). Rising current indicates bearing wear, material buildup, or liner damage. Screen vibrator motors should draw steady current (8-12A for typical 3 kW motors) — fluctuating current means loose mounting bolts or worn vibration springs.
Throughput rate monitoring shows capacity loss over time. A reclamation line rated for 40 tons/hour should maintain 38-42 tons/hour in normal operation. If throughput drops to 35 tons/hour, something is restricting flow — usually screen blinding or crusher wear. The PLC calculates throughput from belt scale data or volumetric flow sensors, logging it every minute. Graph 30 days of data and you'll see the gradual decline that operators miss during daily shifts.
Alarm history analysis reveals patterns. If your magnetic separator belt-tracking alarm fires twice per shift, the belt or rollers need service. If dust collector high-pressure alarms increase from once per week to daily, filters are loading faster than pulse cleaning can handle — time for replacement. We set up alarm trending for a foundry in Ohio that was ignoring nuisance alarms; turned out their crusher bearing was failing and the vibration alarm had been firing for three weeks before the bearing seized.
Remote parameter adjustment lets you optimize performance without on-site visits. Crusher speed (typically 900-1200 RPM), screen vibration frequency (typically 1400-1600 RPM), and magnetic separator belt speed (typically 0.3-0.5 m/s) can all be adjusted through the HMI. If your LOI creeps up, try reducing crusher speed by 50 RPM to increase impact energy per particle. If you're getting too many fines, increase crusher speed slightly to reduce dwell time. These adjustments take 30 seconds through remote access vs. half a day for an on-site visit.
TZFoundry's Foundry Sand Reclamation Production Line systems ship with English-language HMI and remote diagnostics as standard. The PLC stores 90 days of operating data at 1-minute resolution, enough to catch gradual performance drift that daily checks miss.
Benchmark Framework: How to Measure Recovery Rate Properly
You can't improve what you don't measure correctly. Sand reclamation recovery rate is the percentage of used sand that returns to production-ready condition after processing. But "production-ready" has specific criteria that many foundries skip.
LOI (Loss on Ignition) testing measures residual binder content. Pull a 50-gram sample from reclaimed sand discharge, weigh it, heat it to 650°C for 30 minutes, then weigh again. The weight loss percentage is your LOI. Target values depend on binder type: furan sand should hit <0.3% LOI, phenolic <0.5%, sodium silicate <0.2%. Higher LOI means incomplete binder removal — that sand will cause mold defects if it goes back to the mixer.
Grain fineness number (GFN) testing confirms particle size distribution. Use a standard sieve set (12, 20, 30, 40, 50, 70, 100, 140, 200, 270 mesh) and calculate GFN per AFS standards. Reclaimed sand should match your base sand GFN within ±3 points. If your base sand is GFN 55 and reclaimed sand tests at GFN 48, you're over-crushing and generating too many fines. If reclaimed sand tests at GFN 62, you're under-crushing and leaving oversized particles.
Sieve analysis shows the full particle distribution. Run a 100-gram sample through the sieve set and weigh the retained fraction on each screen. Reclaimed sand should show <5% retained on 20-mesh (oversized lumps), <3% passing 140-mesh (excessive fines), and 70-80% in the 40-70 mesh range (usable sand grains). Distributions outside these ranges indicate crusher or screen problems.
Magnetic contamination test measures metallic content. Pass 1 kg of reclaimed sand over a strong magnet (1500+ gauss) and weigh the captured material. Ferrous content should be <0.1% by weight. Higher contamination means your magnetic separator isn't working — either belt gaps, weak magnets, or belt speed too fast for effective capture.
Recovery rate calculation combines these measurements. Start with 1000 kg of used sand input. After reclamation, you'll get three output streams: reclaimed sand (passes all quality tests), waste fines (too small, fails sieve analysis), and rejects (fails LOI or contamination tests). If you get 950 kg of quality reclaimed sand, your recovery rate is 95%. The other 50 kg goes to disposal.
We test every Resin Sand Reclamation Plant in our facility before shipment. The commissioning report includes actual recovery rate data from your specific unit, measured with the test protocol above. That's not a marketing claim — it's the performance you'll see when the line arrives at your foundry, assuming you maintain it properly.

When Maintenance Alone Cannot Restore Target Recovery
Sometimes the problem isn't maintenance — it's equipment capacity or design limits. If you've replaced all wear components, optimized PLC parameters, and your recovery rate still sits at 88-90%, the line might be undersized for your current throughput or sand type.
Throughput overload happens when foundries increase production without upgrading reclamation capacity. A line designed for 30 tons/day can't maintain 95% recovery at 50 tons/day — residence time in the crusher drops, screen loading increases, and dust collection can't keep up. The fix isn't more maintenance; it's adding a second reclamation line or upgrading to higher-capacity equipment.
Sand type mismatch shows up when you switch binder systems. A reclamation line optimized for furan sand (softer binder, easier to crush) will struggle with phenolic sand (harder binder, requires more impact energy). Crusher liner material, rotor speed, and screen mesh selection all need adjustment. If your line was commissioned for one binder type and you've switched to another, recovery rate drop is expected — you need equipment reconfiguration, not just maintenance.
Thermal reclamation requirements apply when mechanical reclamation can't hit your LOI targets. Some high-resin sand systems (coated sand, hot-box processes) leave binder residue that mechanical crushing can't remove. Thermal reclamation (heating sand to 600-800°C to burn off binder) is the only way to reach <0.2% LOI. If your mechanical line consistently delivers 0.4-0.6% LOI despite perfect maintenance, you're hitting the process limit — time to evaluate thermal reclamation equipment.
Contamination sources upstream can overwhelm even well-maintained reclamation lines. If your shakeout system dumps excessive metallic debris into the sand stream, magnetic separators can't keep up. If mold coatings or core binders contaminate the sand, no amount of crushing will restore quality. These problems require fixes at the molding or casting stage, not at reclamation.
When you're evaluating whether to maintain or upgrade, calculate the cost difference. Maintenance (liners, screens, filters) runs $8,000-12,000 annually for a 40-ton/day line. A new reclamation line costs $80,000-150,000 depending on capacity and features. If maintenance keeps you at 92% recovery and a new line would hit 96%, the 4% improvement saves $73,000 annually in sand costs (at 40 tons/day, $150/ton new sand, $80/ton disposal). The new line pays for itself in 14-18 months.
TZFoundry's engineering team can review your current reclamation line setup and recommend whether maintenance adjustments or equipment upgrades make more sense for your situation. Send us your current recovery rate data, sand type, and throughput requirements — we'll provide specific recommendations with factory pricing. Request a Quote with your operating parameters and we'll respond within 24 hours.
Practical Recommendations for Sustained 95%+ Recovery
Recovery rate maintenance isn't complicated, but it requires discipline. The foundries that consistently hit 95%+ recovery follow three practices:
Track component wear by tonnage, not calendar time. A maintenance schedule that says "replace crusher liners every 3 months" fails when production rates change. Track tons processed through the line (your PLC can log this automatically) and schedule replacements at tonnage intervals. Crusher liners at 2500 tons, screen meshes at 1200 tons, dust filters at 8000 tons processed. This matches maintenance to actual wear instead of guessing.
Test reclaimed sand quality weekly, not monthly. LOI and sieve analysis take 45 minutes. Run these tests every week and you'll catch recovery rate drift before it costs you thousands in wasted sand. Monthly testing means you're operating blind for 3-4 weeks between data points — plenty of time for a worn crusher liner to drop your recovery from 95% to 89%.
Use PLC data to predict failures, not just react to them. If crusher motor current rises 15% over two weeks, bearings or liners are wearing. If screen vibrator current fluctuates, mounting bolts are loose. If throughput drops 5% over a month, something is restricting flow. These trends show up in PLC logs days or weeks before operators notice problems. Download and graph your data monthly — it's the cheapest predictive maintenance tool you have.
The difference between 90% and 95% recovery is $46,000 annually for a 40-ton/day foundry. That's enough to justify a dedicated maintenance technician, a full set of spare parts inventory, and monthly PLC data analysis. The foundries that treat sand reclamation as a cost center instead of a profit protector are the ones calling us about replacement lines every 3-4 years.
For more information on complete Resin Sand Production Line systems including mixing, molding, and reclamation equipment, visit our product pages or contact our engineering team with your specific requirements.

Liu Haoran is the Resin Sand Production Line Technical Manager at TZFoundry. Over 11 years of hands-on work with furan, phenolic, and coated sand systems, he has commissioned 40+ resin sand lines for export buyers and developed binder dosing protocols...